In the previous article, you have learned about the most popular fibonacci retracement levels (23.6%, 38.2%, 50%, 61.8%, 78%). Now, it is time to learn how to draw them and how you can use them in your trading.
How to draw the retracement levels? It is easy like ABC
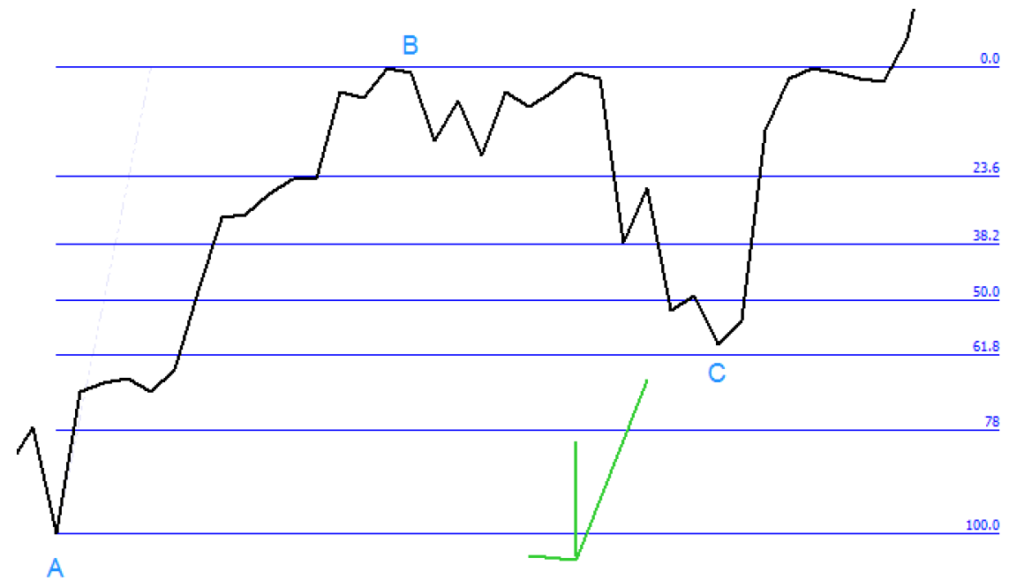
So far, we have learned that it is very rare for a price to move in one direction for a longer time. Surely, when there is panic or euphoria on the market because of some big news, prices may skyrocket and it is hard to enter the trade. In most cases though, the price moves in zigzag shapes. Some traders call it waves, and there is a scientific concept called Elliott wave theory. But for us it is important to know the nature of these moves. First, we need to identify a swing move that is a move from point A to point B. We know already that after the main swing there should be a correction in the opposite direction to point C. When we see a move from point A to B, we wait for a move down (correction) to point C. Point C should be located between points A and B. On a chart illustrating an uptrend it may look like this:
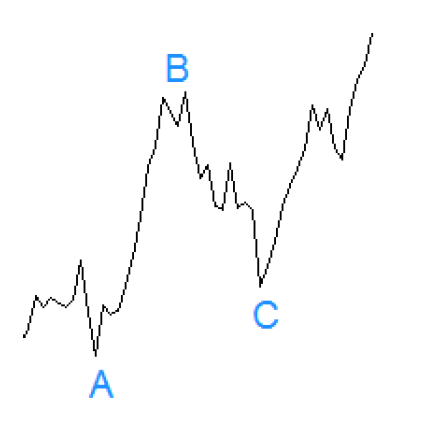
It is not always so easy to identify points A, B, and C, but it gets easier with time and experience. When we are sure that we have found the ABC move, we can draw a Fibonacci retracement with a tool from our chart software. We start from the low of swing to the high, so from point A to point B.
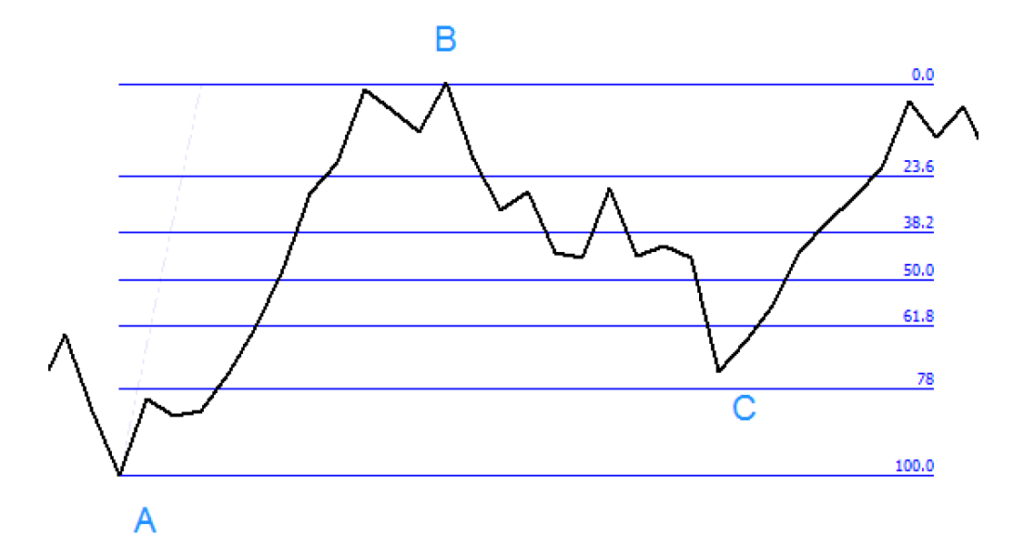
If you use candle charts, you should draw from the low of the shadow (or peak) of a candle to the high of a candle. Please, notice that you get much more accurate results when you apply the retracement levels to your candle chart. Compare it with the results from the above chart.
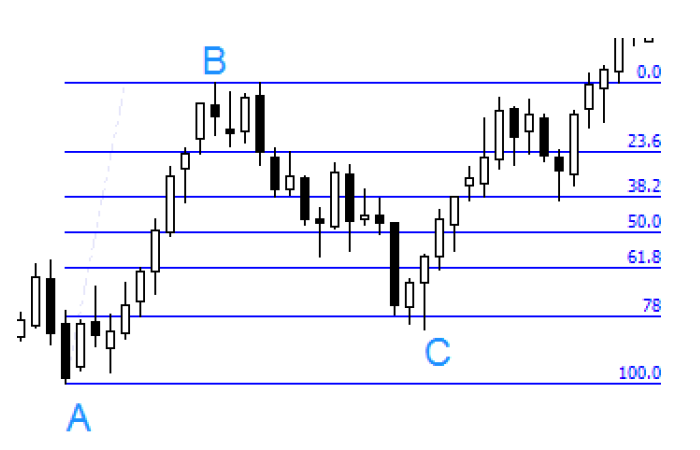
How do you know if you have chosen the right top and bottom? It is a little bit like art and comes with time. At times, when you have two bottoms nearby, even if you have selected the wrong one, it is not going to change the position of the retracement levels so much. Just practice on the price history.
Should the price touch the Fibonacci retracement levels?
This is always a problem for new investors. They think that the retracement to point C is only valid when the price touches down this level. They are wrong. Fibonacci retracements are a great tool, but there is no 100% accuracy. Sometimes the price closes near the retracement level and it can be still a valid move. Just look at the example below.
Example
In a downtrend, there was a correction up. The price looked as if it would move up to 50% retracement level, but it did not happen.
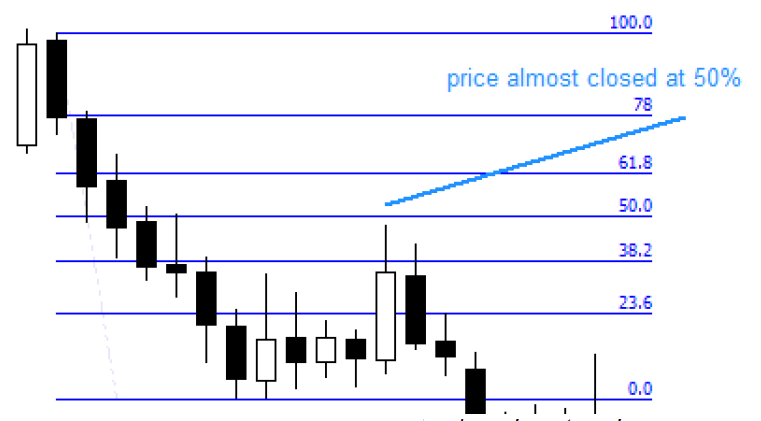
The result was that both candles closed below the 38% level. Still, it is a valid correction to point C, and then the price moved back to a downtrend. Try to pay attention to this. On numerous occasions the price will almost touch your retracement level, which is great. However, be aware that sometimes the price only draws near that level, and still
trading is worth continuing.
What retracement levels should I use?
It is very confusing at the beginning, because there are many Fibonacci retracement levels and some people use only specific ones, while others like to draw all the retracements. My advice is to try to use the standard levels. Over time, when you gain more experience, you will decide which are the most important ones and which ones you prefer to use.
So, which levels should you start with?
- 23.6%
- 38.2%
- 50%
- 61.8%
- 78%.
Why use the 50%? It is not a Fibonacci retracement, but still an important level (half way up or down), so traders like to keep this retracement level together with other proper levels. Stick to these levels and it should be enough to trade well when it comes to price correction.
Fibonacci retracement lines, when should I open a trade?
Now you know how to draw the retracement lines. Thanks to them you can enter a trade with a better price, which is always a good thing. But when should you enter a trade? That is the biggest challenge after drawing the right retracements levels. You can find a more specific information about entering a trade in Part 5. Before you read that part, it is important that you understand the options you have when the price is nears the retracement line. After drawing the retracement levels, you should decide when you want to open your position. You have three options to choose from, but before further explanation, check the chart below.
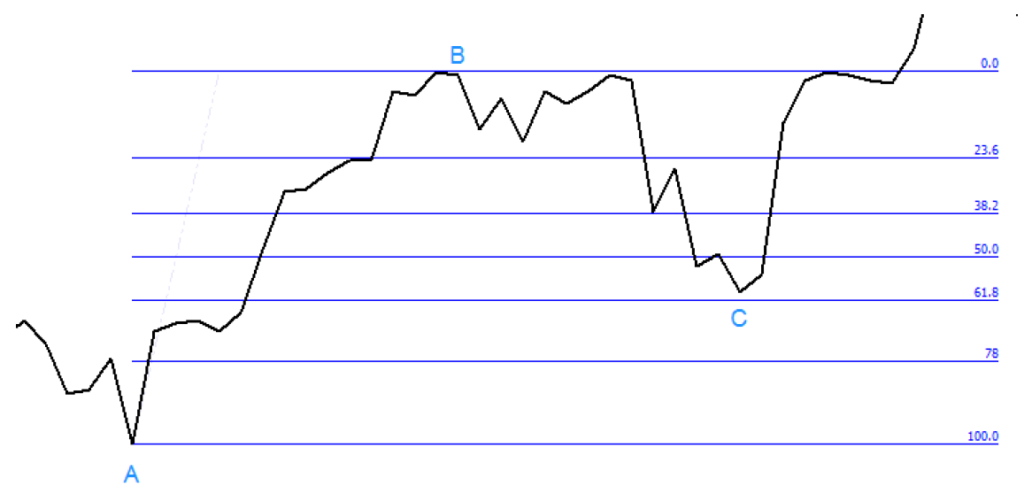
I do not want to complicate things too much, so I have used a line chart, but in real trading, try to use a candlestick chart. We have confirmed that the main trend is strong and is up. After a swing move from A to B, there was a strong correction, so we have drawn the retracement levels. We are waiting to take a long position, because the main trend is up. Now we have three options of doing this.
Fibonacci retracement Option 1
You are willing to take bigger risk in turn for a possible bigger return. When the price (almost) reaches the 61.8% retracement, you go long at this level or a little bit above it. This level is very popular among traders, so, very often, at least for a moment, the price stops here and bounces back.
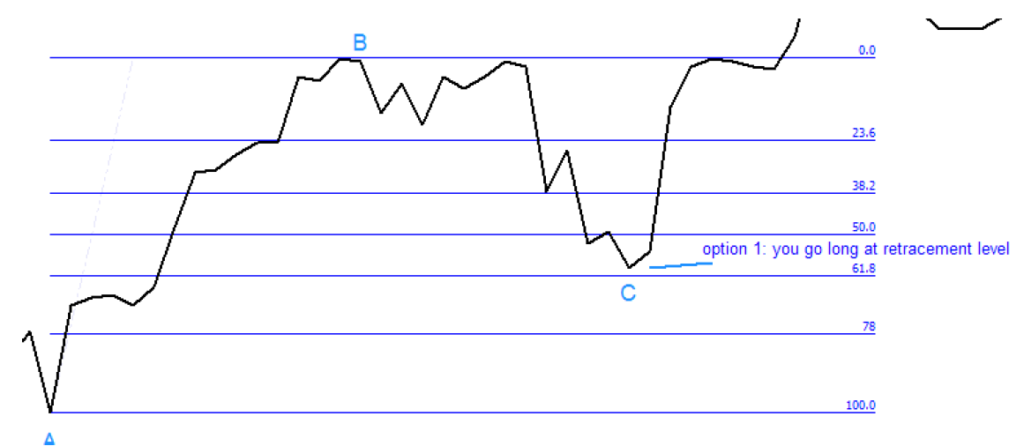
You can take the same action at 50% or 38.2% if you think that the correction ends and there is your point C. Remember, this may not be a bounce to new highs. You do not have the knowledge about it at the time of trading. Having seen the right side of the chart and you know that in that case the correction ended on the 61.8% level. In real life, when you choose this option, you never know if the correction really ended at point C or it was just a false move. But if you are right, your possible profit can be very big.
Option 2
The second option is when you wait and watch how the price reacts towards the retracement levels. If you see that 61.8% is probably the retracement which a bounce back may occur from, you are ready to take a long position. But unlike the first case, you wait for another confirmation. It could be many things, such as a confirmation from an oscillator or moving averages – simply something that is written in your trading plan. When there is a confirmation signal, you go long. Of course, confirmation signals are not always 100% correct, but in that case you have lower chance of failure. This, in my opinion, is a better way to enter trades. The ratio between risk and possible profit is very good. In this example, the trader decided that the signal will be a close of price above resistance.
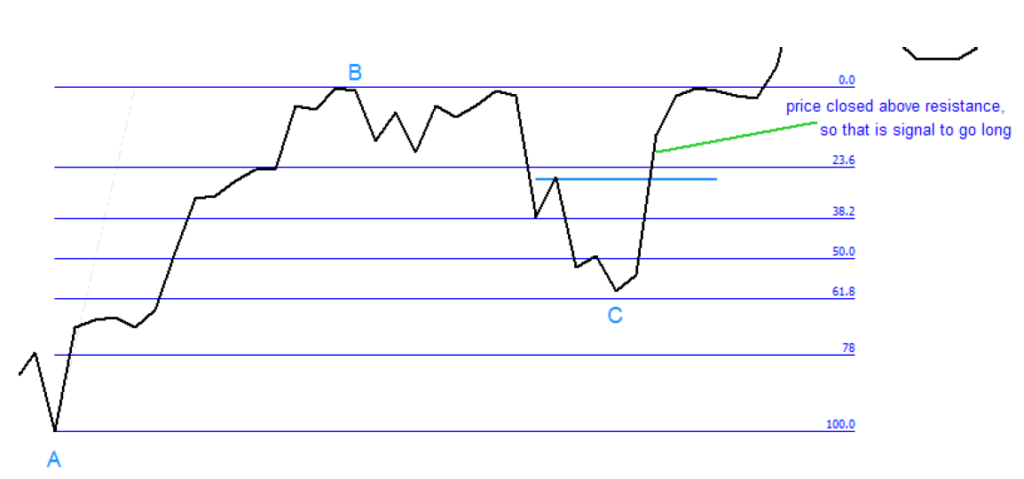
As I have mentioned, you have to decide and test yourself what signal works best for you.
Option 3
In the third case you wait until the price breaks above the recent high (the one you have used to draw your retracement levels – point B). There is a good chance that the move will continue. This way of trading is the safest one, but your possible profit is the smallest.
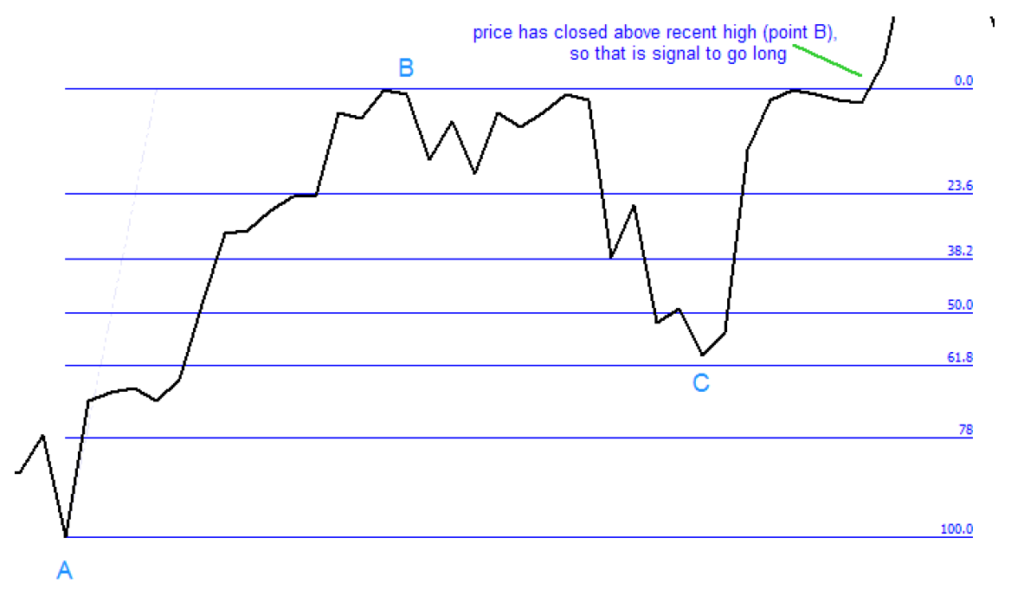
Personally, I trade according to the third scenario very often. The reason for this is simple – there may be a big mess near retracement level and I cannot get a confirmation signal. I simply wait for the break above point B and go long at this point. Which way is the best for you? It is your decision. It depends greatly on your trading skills and mental strength. How much risk are you willing to take? Do you have good and working confirmation signals? You should try all the three ways and decide which one you like the most and can make most money with. You do not buy blindly at the top anymore. Now you have the knowledge and you wait for the correction to buy for a better (lower) price. Of course, your aim is not to catch the bottom, because it is very hard to do, but if you buy after the correction ends, you are ahead of many others investors.
Where to put stops?
The Fibonacci retracements are great when it comes to placing stop losses. Let’s assume that you have a long position opened after a correction to point C. Where should you place the stop loss order? I like to put it below point A, that is, below the place where the swing move started. If the price moves back down below point A, there is probably something wrong with the trend strength. Below, I marked 3 possible places where you can place your stop loss order in such a
case:
It all depends on how aggressive you want to trade. Sometimes I place stop loss just below the 78% retracement line. If you want to place a tide stop loss, you place it below the retracement that you think is your point C. The good thing is that, over time, you will understand the behavior of the price better and you will be able to place the stop losses in better places. There is more about the topic in Part 5, where entering a trade is discussed in detail.
The retracement and trend lines
Sometimes the price trends very nicely and it is easy to see the trend line. In such a case there is a strong chance that when it comes to a correction, it will end at a Fibonacci retracement level closest to the trend line. Fibonacci works great on the trending markets, so it is a good idea to combine these tools. First, you have to draw a trend line.
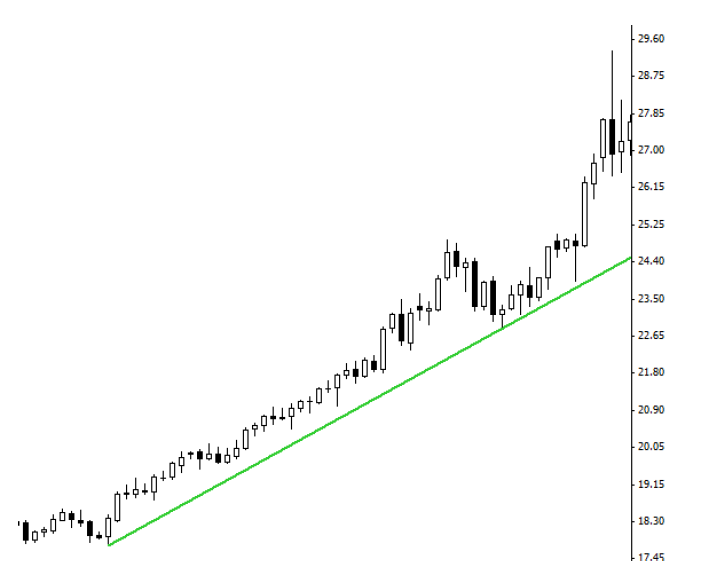
Let’s assume you are waiting for a retest of this line. In the meantime, you can also draw the Fibonacci retracement levels from a low to high swing.
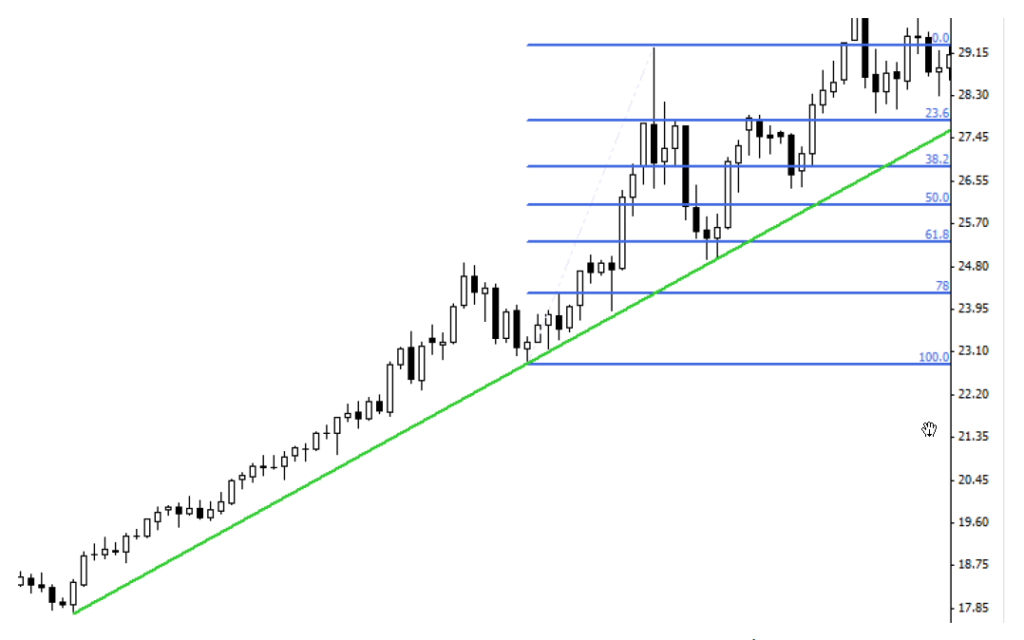
The correction ended at the 61.8 retracement level and the price touched the trend line. As it turned out, it was a great point to enter the trade. You can play this scenario by entering the near retracement level and trend line. You put your stop loss below the trend line, but not too far from it. With a strong trend in place, you assume it is a low-risk entry. It does not always work this well, but sometimes it does. You have to be very watchful about these kinds of price behaviour, because these are good points to enter a trade. The potential risk of loss is small and the potential profit is big.
The Fibonacci retracement and support
Another great way to predict where the price move might end is combining the retracement lines with support levels. It is very simple to do. First, you have to check if there is any important support/resistance level. We look for a few types of support. It may be support from previous important highs, like in the example below:
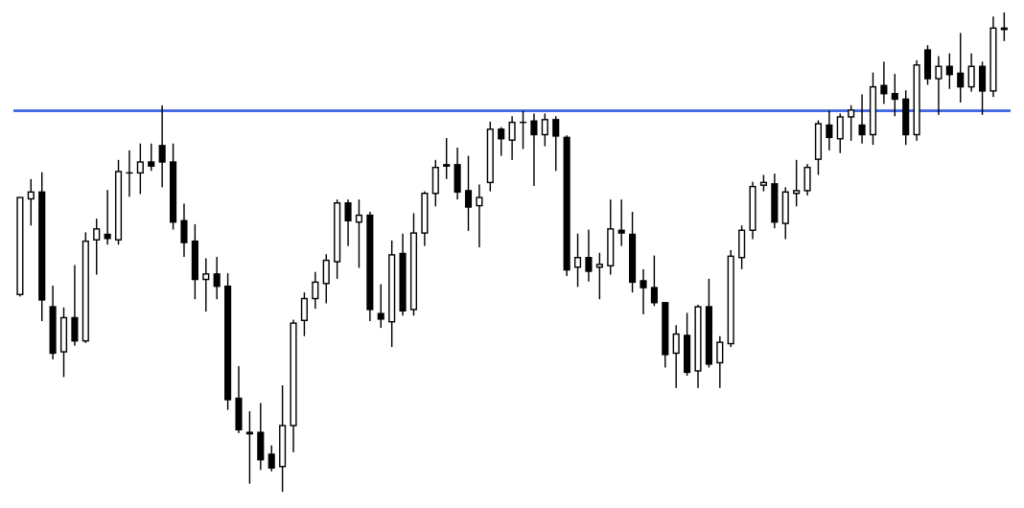
Let’s say that we want to take a long position after a break above this resistance (so we look for a trade in the area near the right side of the chart). On the lower time frame we can spot swing and correction very fast, down to the 61.8% retracement. If you take a closer look, the correction ended almost exactly at the blue line, which now acted as support (because before the price had closed above that line).
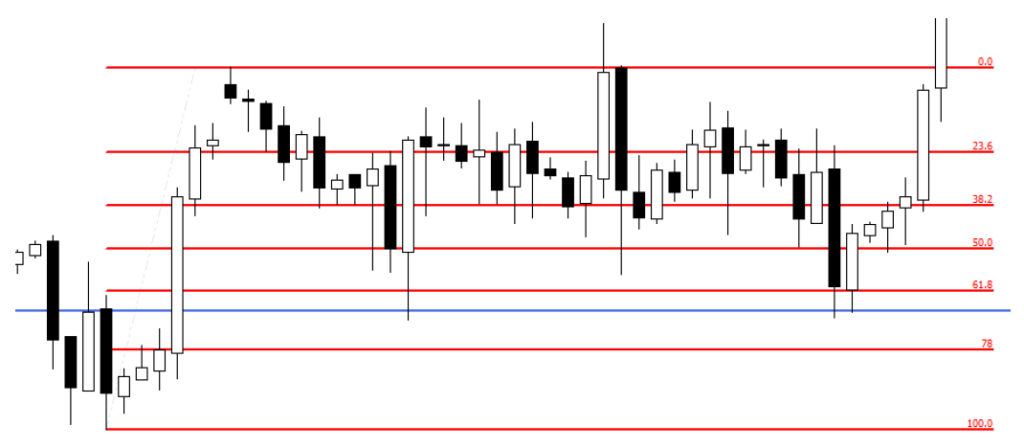
Some traders probably took long positions only because price moved back to the support (blue) line. But you know, with your knowledge about Fibonacci, that when an important support line is in the same area as the retracement level, then it is a trade you should consider to take, because there is a much better chance of success. Another great way to look for support is to combine the retracement levels with moving averages. You probably know that some popular averages work well as support and resistance.
What are these moving averages?
They are: 10, 20, 50, 100 and 200 periods long. Some traders may say that there are more important averages, but this is something you should decide basing on your trading style. From the above set of averages, the most important are the longest ones: 50, 100 and 200. When the price moves back to 200 MA, there is a chance it will find a support there. If you can connect this level with the Fibonacci retracement, you have a potential good entry point. Below there is a 4 hour chart of S&P500. You can see that the price is above the 50 moving average. After a swing, there is a correction down to that moving average and the 50% retracement level which is in the same place. This is obviously a good point to look for an entry.
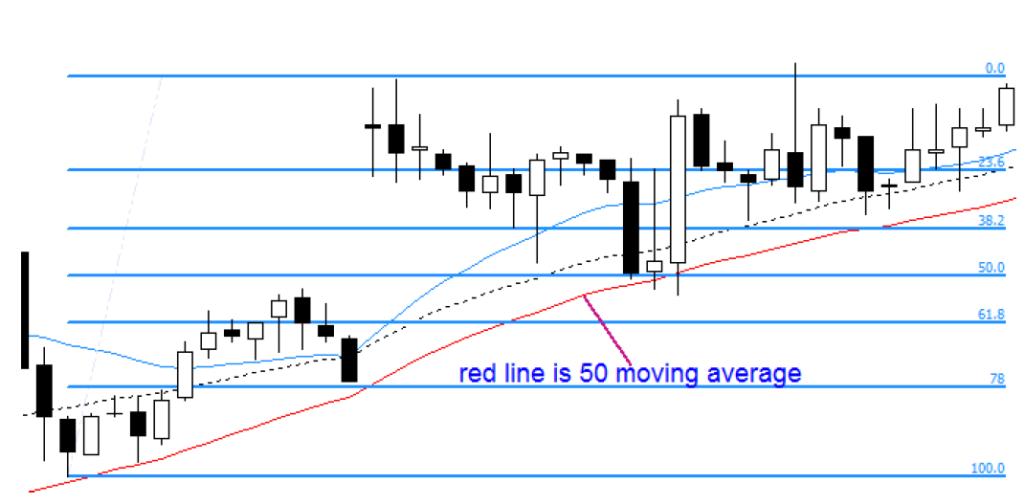
support.
Take a good look at this combination, because on numerous occasions, this is a good point to enter the trade. Not all traders use the Fibonacci retracement for an entry. Some traders tend to enter or reenter a trade at a moving average, because they know that this is good support. You should join this group, but only when you have another confirmation from the Fibonacci retracement.